Greenhouse gas emissions report 2022
On this page, you’ll find a summary of Arhus University's 2022 greenhouse gas emissions report. Click the bar at the top right if you want to read the report in its entirety.
Greenhouse Gas Emissions Report 2022
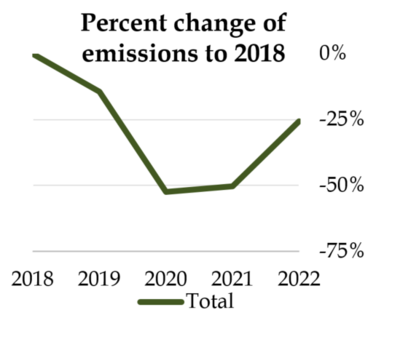
AU’s greenhouse gas (GHG) emissions report for 2022 shows that AUs CO2 emissions increased by 25% in 2022 over 2021. This increase was primarily due to the fact that we resumed our normal travel activities – particularly air travel – after the Covid-19 restrictions were rolled back.
However, since 2018 (baseline year), AU’s has reduced total emissions by 25%, and is still on track to meet the 2025 target set in the university’s climate strategy of a total reduction of 35% over 2018.
More specifically, the GHG emissions report shows that:
- The largest source of Scope 1 CO2 emissions comes from AU’s agricultural research as well as the university’s consumption of gas and biogas
- The largest source of scope 2 CO2 emissions is the university’s consumption of district heating and electricity
- The largest source of Scope 3 CO2 emissions is from purchases of goods and services, in addition to air travel
Methods used to measure emissions
The figures in AU’s GHG emission reports calculated using the process-based method are to a large extent comparable over time. At the same time, as methods of calculation are refined and new data becomes available, AU’s reports will be expanded and adjusted; as a consequence, there are new elements in this report that were not included in previous years, and which cannot be compared with previous years.
Two different methods were used to measure carbon emissions in this report: an activity-based method which has been used since the university began calculating emissions for these reports, as well as a method based on financial data, which has used for the first time in 2020.
Activity-based carbon emission accounting method
This method of measuring carbon emissions involves assigning a specific emission factor to a unit of consumption (for example, kW power consumed). The method is used primarily to calculate AU's CO2emissions within scopes 1 and 2 and parts of scope 3 (air travel, waste, water consumption, investments and fuel value chain).
Financial data-based method
The financial reporting data-based method measures emissions based on the amount of money the university spends within different categories defined by the university’s accounting system. The amount spent within a specific category (such as IT hardware) is assigned a relevant emission factor in order to measure carbon emissions from purchases within the category. The method is used to calculate AU's CO2emissions in parts of scope 3 (purchase of goods and services).
The advantage of using the method based on financial reporting is that it allows us to include elements that the activity-based method doesn’t cover. However, because it’s based on financial data, this method is less suited to comparing developments in emissions over time, as greater spending, all things being equal, results in higher emissions. But overall, the university gains a more accurate overview of its own CO2 emissions by using both methods.
Visual comparison
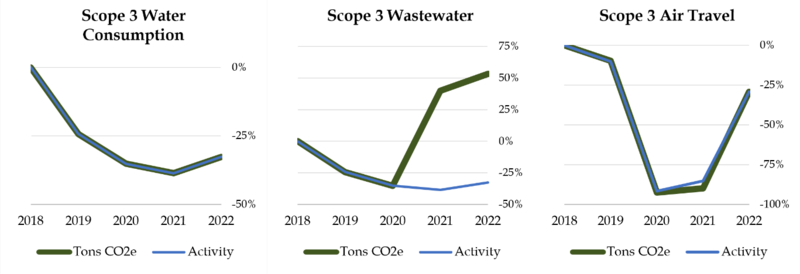
The models below show the trends in activity and CO2 emissions within scopes 1 and 2 and parts of scope 3 in 2018 and 2022 respectively, as measured using the activity-based method. Furthermore, the CO2emissions development for parts of scope 3 is shown as calculated using the of the financial data-based method.
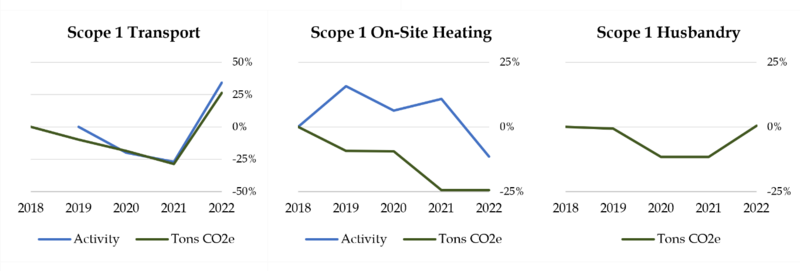
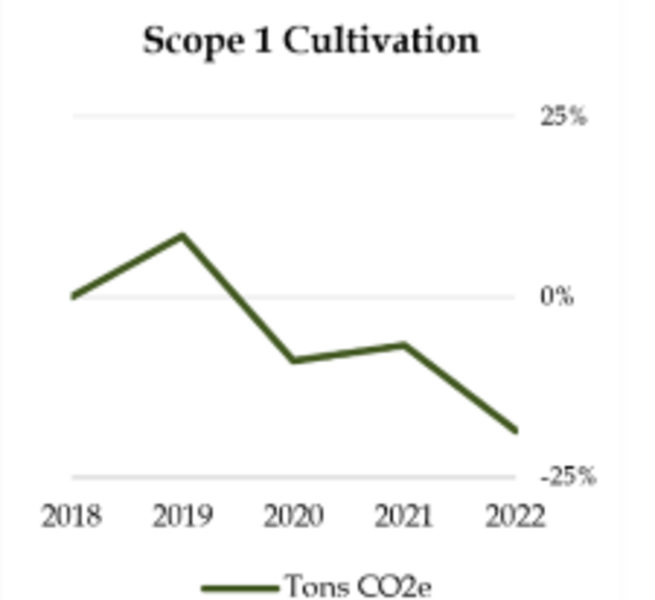
Results for scope 1
AU's CO2 emissions in scope 1 are based on data from the following sources:
- Direct emissions from the university's grounds and facilities, e.g. from oil boilers
- Transport: the research ship Aurora, AU vehicles (in terms of number of kilometres driven) + employee-owned vehicles (in terms of number of kilometres driven during working hours).
- Emissions from agricultural activities
AU’s CO2 emissions in scope 1 = 6,491 tonnes CO2-eq
The largest sources of scope 1 CO2 emissions are AU’s agricultural research as well as the university’s consumption of gas and biogas, as seen below.
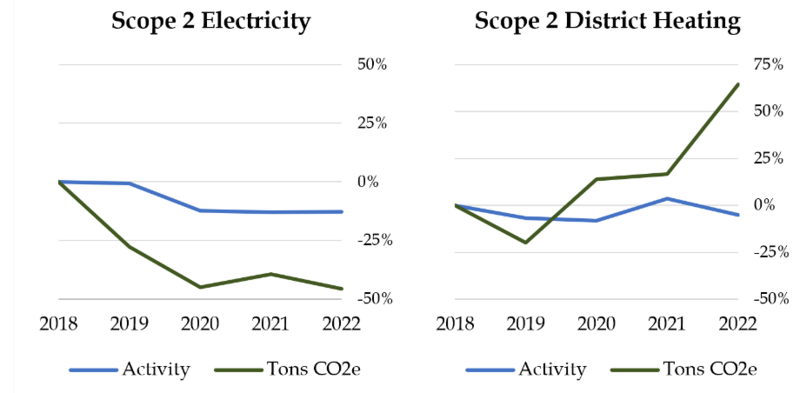
Results for scope 2
Scope 2 is general upstream emissions of energy and is based on data from the following sources:
- Heating
- Electricity
- Cooling
AU CO2 emissions in scope 2 = 9,138 tonnes CO2-eq
The largest source of scope 2 CO2 emissions is the university’s consumption of district heating and electricity
Results for scope 3
Scope 3 includes all upstream and downstream indirect emissions from AU and constitutes a large and complex share of the total CO2 inventory for all enterprises, including AU. This means it is not possible to measure scope 3 as precisely as scopes 1 and 2. However, progress is being made.
Results based on the activity-based method
AU CO2 emissions in scope 3 = 9,8170 tonnes CO2-eq
The greatest source of scope 3 CO2 emissions is air travel.
Results based on the financial data-based method
AU CO2 emissions in scope 3 = 50,018 tonnes CO2-eq
The largest source of scope 3 CO2 emissions is the wholesale purchase of goods and construction equipment and materials (especially gases, machines, electrical, IT hardware and electrical installations).
Total emissions
- The figures from scopes 1 and 2 and parts of Scope 3 (calculated using the activity-based method) result in total emissions of approx. 25,000 tonnes of CO2 in 2022. Emissions increased by about 5,000 tonnes in 2022 over 2021.
- The figures from parts of scope 3 (calculated using the financial data-based method) result in total emissions of approx. 50,000 tonnes of CO2 in 2022, an increase of 10,000 tones over 2021.
AU’s total emissions for 2022 are about 75,000 tonnes CO2.
Word description
The Greenhouse Gas (GHG) Protocol
This approach is used by both companies and public institutions as a framework for determining the company's/institution's CO2 emissions. It is a globally applied and recognised method, and it is used by other universities all over the world. This method makes it possible to compare CO2 emissions across universities.
The Greenhouse Gas Protocol operates with three scopes. 5,000-7,000 companies and institutions use the tool globally. Fewer than 10% of them use scope 3.
Scope 1, 2 and 3
Aarhus University's GHG emissions report is based on the Greenhouse Gas Protocol (GHG Protocol), which is a recognised method of calculating emissions of greenhouse gases by converting them into CO2 equivalents divided into three so-called scopes:
- Direct emissions from the university's property, e.g. from boilers or combined heat and power production at AU, as well as in connection with the use of motor vehicles, operating the research vessel Aurora, or emissions from agricultural activities.
- Indirect emissions related to the university's purchase of heating, electricity and cooling, for example.
- Value-chain emissions, which include purchases and air travel.
AU has collaborated with the other universities in Denmark to develop a common methodology for GHG inventories in the university sector. In order to improve the quality of the GHG report, the method is regularly updated to reflect the latest advances in research.
CO2 equivalents
CO2 equivalents are a conversion factor for comparing the impact of different greenhouse gases on the greenhouse effect. It has been calculated how many tonnes of CO2 are required to cause the same greenhouse effect as one tonne of another gas. This figure is the gas's CO2 equivalent.
Emission factors
Definition: All materials that are warmer than absolute zero emit heat. The higher the temperature, the higher the radiation. Different materials have different abilities to radiate heat (at the same temperature) – this is called emission.
The emission factors in this report are based in part on figures from 2021 and in part on the preliminary emission factor figures fpr 2022 from the Danish Energy Agency. The GHG emissions report will be updated when all emission factors for 2022 are available.