Gender distribution among new VIP employments
Here you can find key figures on new VIP employments at AU.
The figures are updated on a yearly basis and relate to AU's action plan for gender equality 2023-2025.
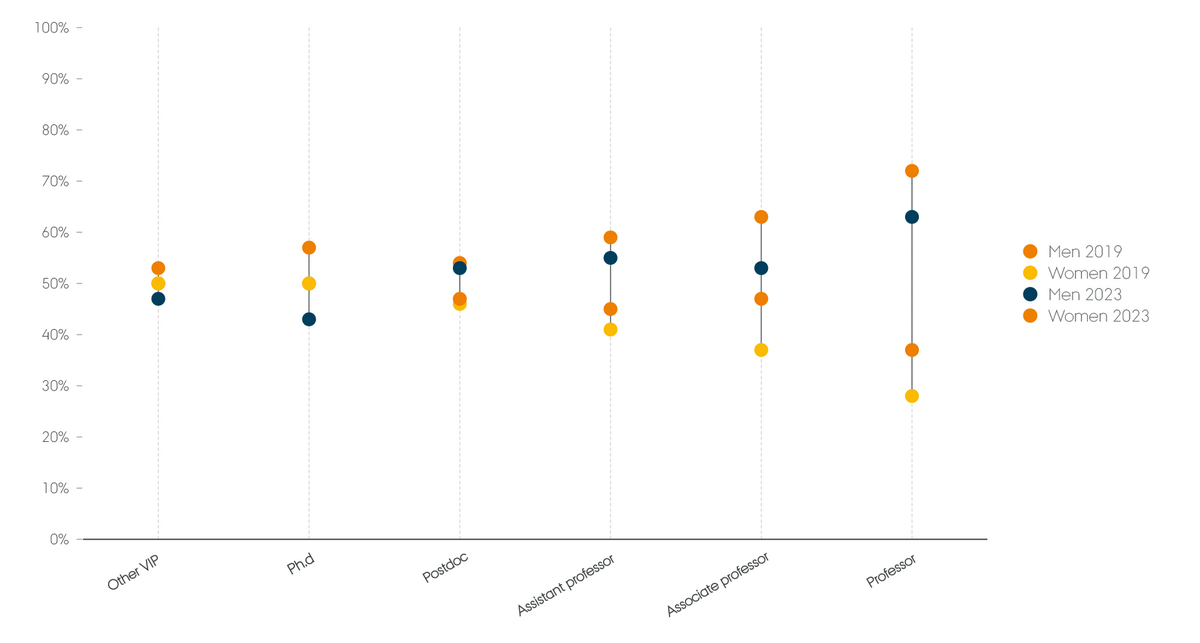
Gender distribution among new employments VIP 2019-2023 in table form
| Category and year | Other VIP | PhD | Postdoc | Assistant professor | Associate professor | Professor |
|---|---|---|---|---|---|---|
| Women 2019 | 50% | 50% | 46% | 41% | 37% | 28% |
| Men 2019 | 50% | 50% | 54% | 59% | 63% | 72% |
| Women 2023 | 53% | 57% | 47% | 45% | 47% | 37% |
| Men 2023 | 47% | 43% | 53% | 55% | 53% | 63% |
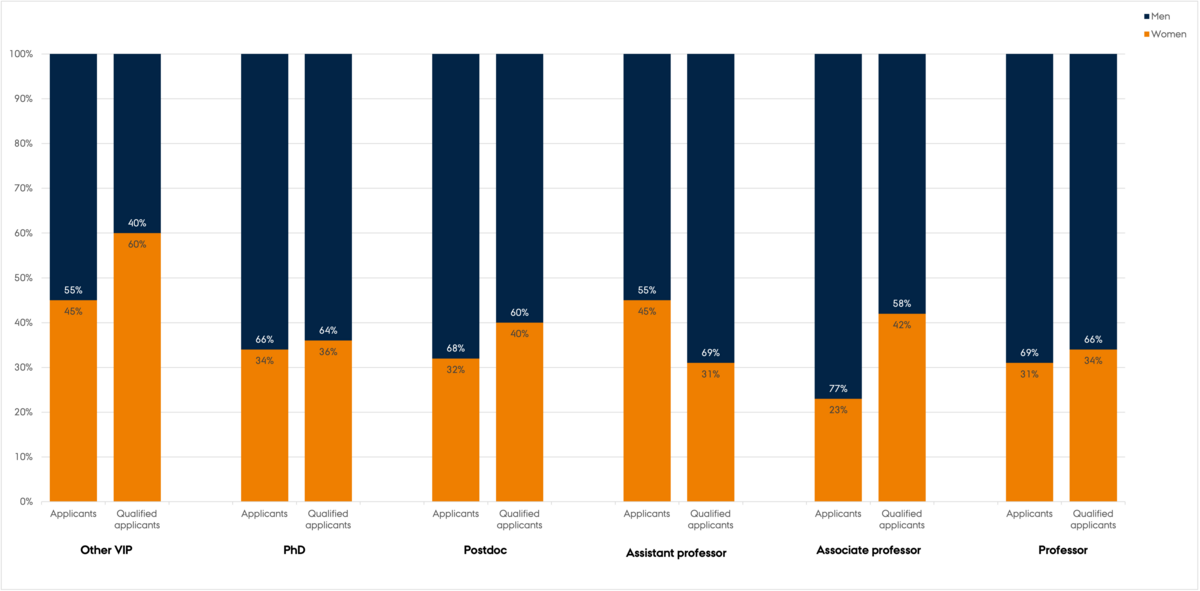
Gender distribution among applicants and qualified applicants in 2023 in table form
| Category | Applicants | Qualified applicants |
|---|---|---|
| Other VIP | Men: 45% Women: 55% | Men: 40% Women: 60% |
| PhD | Men: 66% Women: 34% | Men: 64% Women: 36% |
| Postdoc | Men: 68% Women: 32% | Men: 60% Women: 40% |
| Assistant professor | Men: 55% Women: 45% | Men: 69% Women: 31% |
| Associate professor | Men: 77% Women: 23% | Men: 58% Women: 42% |
| Professor | Men: 69% Women: 31% | Men: 66% Women: 34% |