AU PowerPoint
How to use the presentation
The presentation provides a general overview of essential key figures and facts about Aarhus University and the faculties.
It is organised around the topics research, education, cooperation, talent, campus and sustainability.
You can either use the presentation in its entirety or simply choose the slides that you find relevant.
Please note that a number of slides include notes with supplementary facts/explanations.
- Download the AU Powerpoint (Updated September 2024)
NOTE: AU’s Office templates must be installed on your computer in order to view and edit the presentation. Download here
How often is the presentation updated?
All figures in the presentation are based on the most recent official figures from AU Key Statistics 2023.
The presentation is updated once a year, normally in September. In order to be certain that you are using the correct figures, we recommend that you download the presentation/relevant slides each time you use them, rather than making changes in an old version of the presentation downloaded on a previous occasion.
Add slide show or more images
You can conclude your presentation with a slide show of a series of images that are shown in turn automatically.
You can choose between two slide carousels in PowerPoint:
Read this description to find out how (PDF).
Of course, you can also select individual images and use them in your presentation.
How to change date and name
Select the ‘AU’ tab.
Click ‘Document details’.
Insert the desired date and name.
How to change date and name
Select the ‘AU’ tab.
Click ‘Document details’.
Insert the desired date and name.
Showing the presentation on your tablet/smartphone
To make sure that your device displays the presentation correctly, save the presentation as a PDF.
- Open the presentation in PowerPoint.
- Click ‘File’ on the menu bar and select ‘Save as’.
- Select ‘PDF’ on the ‘File type’ dropdown menu.
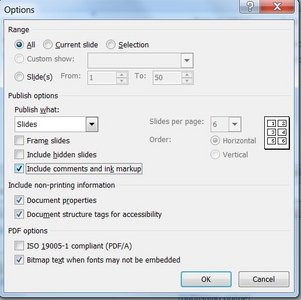
- If you want to include the notes in the PDF, click ‘Options’ in the same window before clicking ’Save’.
- Under ‘Options’, click the dropdown menu under ‘Publish what’ and select ‘Notes pages’.
- Click ‘OK’, and then click ‘Save’ in the main window.

